
Introduction
Copper busbar ampacity is the primary sizing constraint in any power distribution system — get it wrong and you face thermal failure, nuisance tripping, or an oversized and costly installation. Manufacturing facilities, switchgear assemblies, and industrial distribution panels all depend on busbars operating within their thermal limits — yet most specification errors come from treating published ampacity values as universal constants.
Those published values are conditional, not fixed. Each rating assumes a specific copper alloy (typically C11000), defined geometry, a stated temperature rise above ambient, horizontal-on-edge orientation, and open-air installation.
Deviate from any of those baseline conditions — enclosed enclosures, elevated ambient temperature, flat mounting, or AC harmonic loading — and explicit derating is required.
This article covers:
- The standard current carrying capacity table for Copper C11000 busbars
- What drives each column in that table and how to read it
- The thermal basis for ampacity limits and CDA reference data
- Common misapplications that lead to undersized or oversized selections
Key Takeaways
- Ampacity is thermally limited by cross-sectional area, temperature rise, bar orientation, emissivity, and ambient conditions
- Standard CDA tables assume 40°C ambient, 0.4 emissivity, and horizontal-on-edge orientation — deviate from any of these and you must derate
- Three temperature rise tiers (30°C, 50°C, 65°C above ambient) map to conductor temperatures of 70°C, 90°C, and 105°C
- Skin effect in AC systems reduces effective ampacity below DC values, particularly for wide bars at 60 Hz
- Enclosed installations, stacked bars, elevated ambients, and harmonic loads all cut usable ampacity below published values
What Ampacity Means for Copper Busbars
Ampacity is the maximum continuous current a conductor can carry without exceeding a specified temperature rise above ambient. For busbars, this definition diverges from wire ampacity. A flat rectangular cross-section has far more surface area than a cylindrical conductor, which changes how I²R heat is generated and how convective and radiative heat dissipation performs.
Ampacity represents thermal equilibrium: the busbar stabilizes at a steady-state temperature where heat from resistive losses equals heat dissipated to the surrounding environment. Increasing current shifts this balance upward until a new, higher operating point is reached.
According to IEEE Std 605, conductor temperature depends on the balance between heat input (I²R losses modified by skin effect) and heat output through convection, radiation, and conduction.
This means ampacity is a fixed design ceiling, not an adjustable parameter. Bar geometry, alloy conductivity, and installation conditions determine the rated value — load current is what must be managed below it.
Reference Material: C11000 Copper
Copper C11000 (Electrolytic Tough Pitch copper) is the standard reference alloy for busbar ampacity tables. Key material properties include:
- Conductivity: 100% IACS (International Annealed Copper Standard) minimum in the annealed condition
- Resistivity: 10.371 ohm-circular-mils/foot at 20°C
- Application: Standard for electrical distribution busbars in industrial and commercial installations
All published DC resistance and ampacity data in the Copper Development Association (CDA) reference tables are based on C11000 material properties.
Rated vs. Actual Field Ampacity
Rated ampacity is the published ceiling under standard test conditions. Actual field ampacity is what the bar can carry given real-world installation variables. Bridging these two requires understanding the derating factors covered in this article — enclosure type, orientation, ambient temperature, and harmonic loading all reduce the usable current below the table value.
Copper Busbar Ampacity Chart: Current Carrying Capacity Table
The CDA publishes the authoritative ampacity table for C11000 copper busbars under controlled conditions. Table structure includes:
- Dimensions: Thickness × width (inches)
- Cross-sectional area: Square inches and circular mils
- DC resistance: Microhms per foot at 20°C
- 60 Hz AC ampacity: Three temperature rise tiers (30°C, 50°C, 65°C), each with its skin effect ratio
Standard Ampacity Table (C11000 Copper, 60 Hz AC)
Conditions: Indoor, 40°C ambient, horizontal-on-edge orientation, 0.4 emissivity, free from external magnetic influences
| Size (Thickness × Width) | Area (sq. in.) | Area (circular mils) | DC Resistance @ 20°C (µΩ/ft) | Skin Effect Ratio @ 90°C | 30°C Rise (A) | 50°C Rise (A) | 65°C Rise (A) |
|---|---|---|---|---|---|---|---|
| 1/8" × 1" | 0.125 | 160,000 | 30.86 | 1.00 | 250 | 335 | 385 |
| 1/8" × 2" | 0.250 | 320,000 | 15.43 | 1.00 | 450 | 605 | 695 |
| 1/8" × 4" | 0.500 | 640,000 | 7.72 | 1.02 | 775 | 1,050 | 1,205 |
| 1/4" × 2" | 0.500 | 640,000 | 7.72 | 1.02 | 600 | 810 | 930 |
| 1/4" × 4" | 1.000 | 1,280,000 | 3.86 | 1.11 | 1,250 | 1,700 | 1,950 |
| 1/4" × 6" | 1.500 | 1,920,000 | 2.57 | 1.18 | 1,725 | 2,340 | 2,685 |
| 1/2" × 2" | 1.000 | 1,280,000 | 3.86 | 1.11 | 1,000 | 1,350 | 1,550 |
| 1/2" × 4" | 2.000 | 2,560,000 | 1.93 | 1.21 | 1,900 | 2,575 | 2,955 |
| 1/2" × 6" | 3.000 | 3,840,000 | 1.29 | 1.25 | 2,625 | 3,560 | 4,085 |
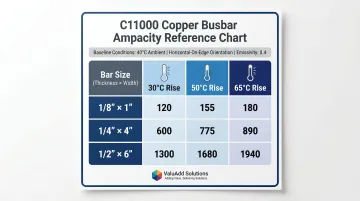
Source: Copper Development Association C11000 Ampacity Tables
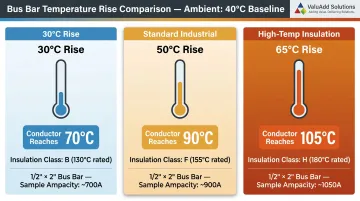
Understanding the Three Temperature Rise Tiers
All three tiers assume the same 40°C ambient baseline. The temperature rise is the additional heat above ambient — so a 50°C rise means the conductor reaches 90°C total.
30°C Rise (70°C conductor temperature):
- Conservative tier for applications with heat-sensitive insulation or adjacent components
- Used where Class B insulation (130°C max) requires additional safety margin
- Example: A 1/2" × 2" bar carries 1,000 A at 30°C rise
50°C Rise (90°C conductor temperature):
- Standard design choice for most industrial switchgear and distribution applications
- Balances conductor utilization with reasonable thermal margins
- Example: The same 1/2" × 2" bar carries 1,350 A at 50°C rise
65°C Rise (105°C conductor temperature):
- Upper range applicable where insulation class and clearances permit operation to 105°C conductor temperature
- Typical for Class F (155°C) or Class H (180°C) insulation systems
- Example: The same 1/2" × 2" bar carries 1,550 A at 65°C rise
The tier you select — not the bar size — determines whether that 1/2" × 2" bar is rated for 1,000 A or 1,550 A. Always verify against the insulation class and thermal design of the surrounding system.
Standard Conditions Applied to All Table Values
Published table values apply only when these conditions are met:
- Indoor installation with free air circulation
- 40°C ambient temperature
- Horizontal-on-edge mounting (long axis vertical, wide face exposed)
- Free from external magnetic influences (no proximity to ferrous materials or parallel conductors)
- Emissivity of 0.4 (typical of a bar in service for ~60 days in an industrial environment)
Any deviation from these baseline conditions requires derating — which is where DC resistance and skin effect values become the working inputs.
DC Resistance and AC Skin Effect Ratio
Two values in the table feed directly into real-world loss calculations:
- DC resistance — verifies I²R losses at a given current level and serves as the baseline for calculating AC resistance
- Skin effect ratio — the ratio of AC to DC resistance at 60 Hz; values above 1.00 mean current is concentrating near the conductor surface, raising effective resistance
For example, a 1/4" × 10" bar has a skin effect ratio of 1.26 — AC resistance runs 26% higher than DC. For larger, wider bars, this gap grows and reduces 60 Hz ampacity below what DC resistance alone predicts.
Key Factors That Affect Copper Busbar Ampacity
Busbar Orientation
Published tables assume horizontal-on-edge mounting (long dimension vertical), which maximizes natural convection cooling along the wide face. Mounting flat (long dimension horizontal) reduces effective cooling and lowers usable ampacity.
The CDA explicitly warns that "ampacities of bus bar systems of other configurations must be calculated, taking into account size, spacing, number of bus bars and overall skin-effect ratio." No universal percentage derating factor for flat-wise or vertical mounting exists in the primary CDA/IEEE tables; thermal analysis or testing is required.
Ambient Temperature Correction
Table values assume 40°C ambient. Higher ambient temperatures reduce the available temperature rise budget, requiring either lower operating current or a step up in bar size.
Unlike NEC wire ampacity tables, no single universal ambient correction multiplier exists for busbars. International standards such as IEC 61439-1 require thermal verification when ambient exceeds the reference baseline. As a practical guideline, each 10°C increase in ambient above 40°C reduces usable ampacity by approximately 10-15%.
Example ambient correction scenarios:
- 50°C ambient: Reduce table ampacity by ~10-15%
- 60°C ambient: Reduce table ampacity by ~20-30%
These corrections are approximations; enclosed or high-altitude installations require specific thermal modeling.
Enclosures and Restricted Airflow
Open-air ratings do not apply to bars installed inside metal enclosures or cable trays with restricted airflow. Enclosed installations accumulate heat, and effective ampacity can drop well below published open-air values.
IEC 61439-6 requires that busbar trunking units undergo specific derating calculations and thermal verification testing to establish rated current inside an enclosure. Never apply open-air ampacity values to enclosed busbars without manufacturer-verified derating factors or specific thermal modeling.
ValuAdd's NEMA Type 4X and 12-rated control panels are designed for environments where dust, moisture, and restricted airflow compound enclosure heat buildup — conditions that directly affect system-level current ratings.
AC Skin Effect and Harmonics
The skin effect ratio in the ampacity table represents the ratio of AC to DC resistance at 60 Hz. A ratio of 1.20 means AC resistance is 20% higher than DC, reducing effective ampacity at that frequency.
In systems with non-linear loads such as variable frequency drives (VFDs), harmonic currents increase RMS current and heat generation beyond what the fundamental 60 Hz rating assumes. IEEE Std 519 provides guidelines for limiting harmonic distortion, noting that uncontrolled harmonics cause "overheating of electrical equipment." Higher-frequency harmonic components suffer from even greater skin effect, increasing effective AC resistance and necessitating thermal derating or oversizing.
Specifying IEEE 519-compliant drives reduces harmonic distortion at the source, keeping actual busbar loading closer to rated conditions. ValuAdd's IEEE 519-compliant VFD lineup addresses this directly:
- Benshaw H2 519/519P Series: 18-pulse design delivers <8% THDv and <5% TDDi, meeting IEEE 519-2014 Table 1 and Table 2 limits
- Medium Voltage VFDs (MVH2 and M2L Series): H-Bridge multi-level topology produces near-sinusoidal output with low harmonic content
Both options reduce thermal stress on busbars and extend equipment service life.
Multiple Parallel Bars
Stacking bars increases total cross-section but inner bars lose cooling surface area. The first bar carries proportionally more of the total current than additional bars, and ampacity per bar decreases with each added bar.
For DC systems, ATIS T1.311 provides authoritative derating factors:
- 2-bar arrangement: Each bar carries ~85% of single-bar ampacity
- 3-bar arrangement: Each bar carries ~75% of single-bar ampacity
- 4-bar arrangement: Each bar carries ~70% of single-bar ampacity
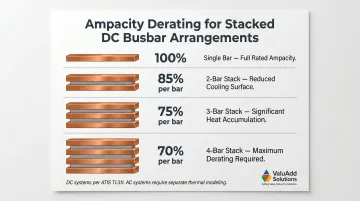
For AC systems, these DC derating factors cannot be applied directly. AC stacked bars suffer from proximity effects (where magnetic fields of adjacent bars force current into smaller cross-sections) and eddy currents. AC stacked busbars must be calculated individually or verified via manufacturer type-testing.
How to Calculate Copper Busbar Current Rating
Step 1: Establish the Design Current
Determine the maximum continuous load current, then apply a safety margin. The NEC mandates that conductors have ampacity not less than the noncontinuous load plus 125% of the continuous load.
Example:
- Continuous load: 800 A
- Design current: 800 A × 1.25 = 1,000 A minimum required ampacity
Step 2: Select the Temperature Rise Tier
Identify the maximum permissible conductor temperature based on the adjacent insulation class and expected ambient. Subtract the ambient from the insulation class limit to get the allowable rise, then match it to the closest standard table tier (30°C, 50°C, or 65°C).
Insulation class limits per IEC 60085:
- Class B: 130°C maximum continuous use temperature
- Class F: 155°C maximum continuous use temperature
If borderline between tiers, default to the lower one.
Example:
- Insulation: Class F (155°C max)
- Ambient: 40°C
- Allowable rise: 155°C - 40°C = 115°C (exceeds table maximum)
- Select: 65°C rise tier (105°C conductor temperature with safety margin)
Step 3: Look Up and Verify Bar Size from Table
In the ampacity table, locate the row where the 60 Hz rating at your selected temperature rise tier meets or exceeds the design current.
Continuing the example:
- Design current: 1,000 A
- Temperature rise tier: 65°C rise
- Table lookup: 1/2" × 2" bar provides 1,550 A at 65°C rise (meets requirement)
Cross-check using current density:
- Bar area: 1.00 sq. in.
- Current density: 1,000 A ÷ 1.00 sq. in. = 1,000 A/in²
- Guideline: 1,000–1,200 A/in² is typical for copper under standard conditions
- Result: Within acceptable range
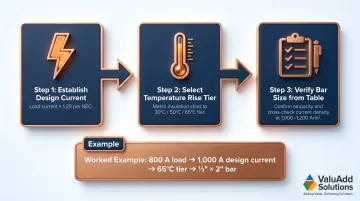
Current density confirms the selection is reasonable — but if the two conflict, size up to the next bar and re-check the table.
Common Misapplications of Copper Busbar Ampacity Data
Applying Table Ampacities Without Checking Installation Conditions
The most frequent error is reading a table value and ordering that bar size without verifying orientation, enclosure type, or ambient temperature. A bar rated at 1,350 A in open-air horizontal-on-edge installation may be significantly derated inside a sealed enclosure at elevated ambient.
Table values are a starting point, not a final answer. Verify that actual installation conditions match the table baseline — or apply appropriate derating factors before sizing.
Ignoring the Skin Effect Ratio for Large Bars in AC Systems
Engineers familiar with DC telecom power systems sometimes apply DC ampacity values directly to 60 Hz AC installations. For narrow bars (skin effect ratio near 1.00), this error is negligible. For wide bars — such as 1/4" × 10" with a skin effect ratio of 1.26 or higher — it can significantly overstate usable ampacity.
When designing 60 Hz distribution systems, always pull from the AC ampacity column — not the DC resistance value.
Assuming Stacked Bars Scale Linearly
Adding a second bar does not double the ampacity. Inner bars lose convective cooling area, and incremental ampacity gain per added bar diminishes. Engineers who stack bars without applying published derating factors consistently underestimate busbar temperature at full load, leading to thermal failures or nuisance tripping.
For DC systems, apply the ATIS T1.311 derating factors. For AC stacked bar arrangements, conduct specific thermal modeling — published derating tables don't fully account for AC heating effects at high current densities.
Frequently Asked Questions
How to calculate copper busbar current rating?
Multiply load current by 125% per NEC requirements to get the design current, then select the appropriate temperature rise tier based on insulation class and ambient temperature. Look up the matching bar size in the CDA ampacity table. Current density (typically 1,000–1,200 A/in² for copper) is a useful sanity check, but the table value is always authoritative.
How many amps can a copper bus bar handle?
A 1/4" × 4" C11000 bar carries approximately 1,250 A at 30°C rise, 1,700 A at 50°C rise, or 1,950 A at 65°C rise under standard open-air conditions. Enclosed installations, elevated ambients, or non-standard orientations reduce these values.
What is the difference between 30°C, 50°C, and 65°C temperature rise ratings?
All three tiers assume the same 40°C ambient baseline; the temperature rise is the additional heat above ambient. A 30°C rise produces a 70°C conductor temperature (conservative, for sensitive insulation), 50°C rise produces 90°C (standard industrial design), and 65°C rise produces 105°C (upper limit for high-temperature insulation systems like Class F or Class H).
Does busbar orientation affect current-carrying capacity?
Yes. Published table values assume horizontal-on-edge mounting (wide face exposed), which maximizes natural convection cooling. Flat mounting reduces ampacity, and vertical mounting results vary by geometry. Standard tables don't cover all orientations, so derating factors or thermal analysis are required for non-standard installations.
What is the skin effect ratio and why does it matter for AC applications?
The skin effect ratio is the ratio of AC to DC resistance at 60 Hz. Values above 1.00 mean the bar's effective resistance is higher under AC because current concentrates near the surface. For larger bars this becomes significant — a 1/4" × 10" bar reaches a ratio of 1.26 — reducing 60 Hz ampacity below what DC resistance alone would suggest.