
Introduction
Sizing a busbar incorrectly doesn't just create inefficiency — it creates risk. Undersized conductors overheat, insulation degrades, and in worst-case scenarios, systems fail under load.
Ampacity tables, published by organizations like the Copper Development Association (CDA), are the standard reference for electrical engineers, panel designers, and system integrators selecting busbars for switchgear, motor control centers, and power distribution systems. The challenge is reading them correctly. Multiple columns cover temperature rise thresholds, skin effect ratios, AC versus DC values, and material cross-sections — each easy to misapply without clear guidance.
This guide explains, section by section, how to read each part of an ampacity table and translate those values into a sound busbar selection decision for real-world installation conditions.
Key Takeaways
- An ampacity table lists the maximum continuous current a busbar can safely carry under specific installation conditions
- Before consulting the table, know your required current load, temperature rise limit, conductor material, and AC or DC system type
- Key columns cover busbar dimensions, cross-sectional area, DC resistance, skin effect ratio, and ampacity at 30°C, 50°C, and 65°C rises
- Skin effect reduces AC capacity compared to DC—larger busbars and higher frequencies increase this effect
- Verify the table's baseline assumptions (40°C ambient, on-edge mounting, free air) match your installation before finalizing size
When Should You Consult a Busbar Ampacity Table?
The table is the right tool when:
- Sizing a new busbar for a panel or distribution system
- Replacing a damaged busbar and verifying the replacement's adequacy
- Reviewing an existing design for compliance with temperature rise limits under increased load conditions
- Performing preliminary engineering calculations during system specification
In ValuAdd's experience, these tables enter the process at the initial specification stage and get revisited during design review to confirm compliance with electrical safety standards.
When the Table Alone Is Insufficient
For installations with unusual enclosure conditions, forced-air cooling, or stacked multi-conductor configurations, the table's baseline assumptions no longer apply. ValuAdd's motor control assemblies housed in NEMA Type 4X and NEMA 12 enclosures—such as the SW Series Washdown Drives and RX4E Series Packaged Soft Starters—are a practical example. Enclosed environments trap heat and reduce effective ampacity, so manufacturer-specific data, thermal modeling, or temperature-rise testing are required instead.
What You Need Before Reading the Table
Gather these prerequisites before opening the ampacity table:
Maximum continuous current (in amperes): Confirm your load current first, including any surge margins or future expansion allowances. Without this figure, you cannot match the correct table row.
Allowable temperature rise: This determines which ampacity column to reference. Most industrial switchgear standards cap temperature rise at 65°C to protect insulation. IEEE C37.20.1 specifies a maximum 65°C rise (105°C total temperature) for silver-surfaced or tin-surfaced joints, and 30°C rise (70°C total) for unplated copper joints.
Conductor material (copper or aluminum): Tables are material-specific. A copper ampacity table does not apply to aluminum because aluminum has roughly 55–61% the conductivity of copper and requires a larger cross-section for the same current. ValuAdd carries copper (Cu-ETP No. 110) and aluminum-compatible busbar systems, so confirm your material before pulling a table.
AC or DC system and frequency: DC ampacity is higher than AC for the same bar size because AC introduces skin effect losses. Confirm your system's operating frequency (typically 60 Hz in North America) before applying AC ampacity values.
Understanding the Structure of a Busbar Ampacity Table
Physical Dimensions Section
Tables list busbar width and thickness in inches or millimeters (such as 1/4 x 2 or 1/2 x 4), which defines cross-sectional area in square inches and circular mils. Circular mils is a common unit for conductor sizing—one circular mil equals the area of a circle with a diameter of one mil (0.001 inch).
Weight and DC Resistance Columns
Two columns in this section serve distinct engineering purposes:
- Weight per foot — accounts for structural loading when mounting busbars on supports or enclosure panels
- DC resistance (microhms per foot at 20°C) — the baseline conductor resistance before frequency and temperature effects apply; decreases as cross-sectional area increases and helps estimate resistive losses and voltage drop over longer runs
Skin Effect Ratio Column
Skin effect is the tendency of AC current to concentrate near the conductor surface at higher frequencies, effectively reducing the usable conducting area. At 60 Hz, the skin depth in copper is approximately 8.5 mm.
The skin effect ratio (typically listed at operating temperature, such as 70°C or 90°C) is a multiplier greater than 1.00 that shows how much AC resistance exceeds DC resistance. For common busbar sizes at 60 Hz, ratios range from 1.00 for narrow, thin bars (such as 1/16 x 1/2 inch) up to 1.72 for very wide, thick bars (such as 3/4 x 12 inch).
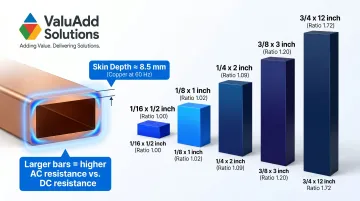
Larger, wider busbars carry higher ratios because skin effect increases with conductor dimensions.
Temperature Rise Ampacity Columns
Most tables present three ampacity values per busbar size, corresponding to temperature rises of 30°C, 50°C, and 65°C above a reference ambient of 40°C. These values already account for the skin effect ratio and represent the maximum current the busbar can carry without exceeding the stated temperature rise.
Selecting a lower temperature rise column results in a conservative, lower ampacity value, requiring a physically larger busbar for the same current.
Baseline Installation Assumptions
Ampacity values apply under a defined set of reference conditions:
- Typical in-service conditions (indoors)
- 40°C ambient temperature
- Horizontal run on edge (narrow face down)
- Emissivity of 0.4 (observed on samples exposed for 60 days in an industrial environment)
- Single bar free from external magnetic influences
Deviation from any of these conditions requires derating or recalculation.
How to Read the Table: A Step-by-Step Walkthrough
Reading the table correctly requires working through a defined sequence. Jumping directly to the ampacity column without first confirming material, temperature rise limit, and installation conditions is the most common error that leads to undersized selections.
Step 1 — Identify Your Required Ampacity
Start with your calculated maximum continuous current load, including any anticipated surge margins or future expansion allowances. This is the minimum ampacity your selected busbar must meet.
For example, if your system's continuous load is 800A and you apply the NEC's 125% sizing requirement for continuous loads (see NEC Article 215.2(A)(1)), your required ampacity is:
800A × 1.25 = 1,000A minimum
Step 2 — Select the Correct Temperature Rise Column
Locate the ampacity column that matches your system's allowable temperature rise:
- 30°C rise: Use in tight thermal environments or where joints are unplated copper
- 50°C rise: A middle-ground option when enclosure ventilation is limited but not restricted
- 65°C rise: Standard choice for industrial panels with plated, bolted joints
Selecting a lower temperature rise column always requires a physically larger busbar for the same current.

Step 3 — Match Dimensions to Required Ampacity
Scan down the selected temperature rise column to find the first busbar size whose listed ampacity meets or exceeds your required current. For wider bars, the skin effect ratio increases, so the effective AC ampacity gain per additional width increment diminishes.
Verify the dimensions are physically compatible with your enclosure and mounting hardware. ValuAdd's SB1-SB2 busbar supports use standardized spacing between attachment points — a useful reference when checking whether a wider bar will fit your panel layout without requiring custom hardware.
Step 4 — Verify the Skin Effect Ratio
Cross-reference the skin effect ratio for your selected busbar size. If the ratio is significantly above 1.00 (e.g., 1.20 or higher for large, thick bars), the AC ampacity will fall noticeably short of the DC baseline. The listed 60-Hz ampacity already accounts for this ratio.
Check that the table's frequency matches your system. Applications running at a non-standard frequency or on DC may require separate adjustments beyond the listed values.
Step 5 — Confirm Physical and Mechanical Data
Review the following columns before finalizing your selection:
- Cross-sectional area and weight per foot — confirm load-bearing capacity and enclosure fit
- DC resistance — use this to estimate resistive losses and voltage drop across longer busbar runs
- Thermal operating range — critical for demanding environments; ValuAdd's Ultraflexx® flexible busbars, rated from -55°C to +125°C, are a practical benchmark for applications where short-circuit heating is a design constraint
Key Factors That Modify Table Ampacity Values
Ambient Temperature Derating
Most tables assume a 40°C ambient. In higher-temperature environments—equipment rooms near furnaces, outdoor installations in hot climates, or tightly enclosed motor control centers—the effective ampacity is lower than the table value.
IEEE C37.20.1 provides a specific formula to calculate allowable continuous load current when ambient air temperature differs from 40°C:
Ia = Ir × √((Tmax - Ta) / Tr)
Where:
- Ia = Allowable current at actual ambient temperature
- Ir = Rated continuous current at 40°C ambient
- Tmax = Allowable hottest-spot total temperature
- Ta = Actual ambient air temperature
- Tr = Allowable hottest-spot temperature rise at rated current
Installation Orientation
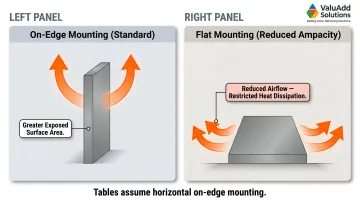
CDA ampacity ratings assume the long axis of the bars is horizontal, mounted on edge (standing upright on the narrow face). This orientation provides better heat dissipation due to greater exposed surface area.
Busbars mounted flat (lying on their broad face) dissipate heat less effectively. The CDA does not publish a single quantitative derating factor for flat mounting. In practice, engineers typically apply thermal modeling or reference manufacturer test data to determine the actual ampacity reduction—flat-mounted bars in tight enclosures can see meaningful capacity loss depending on spacing and airflow.
Multi-Conductor Stacking
When multiple busbars are stacked in parallel—a common practice for very high current applications—heat accumulates between layers, reducing each bar's effective ampacity.
The CDA explicitly states: "Ampacities of bus bar systems of other configurations must be calculated, taking into account size, spacing, number of bus bars and overall skin-effect ratio." There is no universal rule-of-thumb (such as a flat "5% per layer" penalty); designers must rely on thermal calculation methods or manufacturer test data.
Enclosure and Ventilation Impact
Busbars inside enclosed switchgear or motor control centers run hotter than in open-air installations because enclosures trap heat. Proper ventilation design and adequate enclosure sizing are required to approach the table's listed ampacity values.
This is especially relevant for NEMA Type 4X and NEMA 12 enclosures common in industrial and washdown environments. These sealed constructions limit natural convection, so thermal management—through enclosure sizing, forced ventilation, or derating—must be verified before relying on published ampacity figures.
Best Practices for Applying Ampacity Tables in Real-World Selection
Three rules hold up across nearly every busbar selection scenario:
- Size to 125% of continuous load current. This aligns with NEC continuous load requirements and builds in headroom for temperature variation, aging, and load growth.
- Verify the table's material matches your actual busbar. A table for Copper No. 110 (electrolytic tough pitch copper) does not apply to aluminum, brass, or lower-conductivity alloys. Aluminum alloys like 6101-T6 and 1350-H19 carry only 55–61% the conductivity of copper — they require meaningfully larger cross-sections for the same current.
- Record every derating decision. When installation conditions differ from the table baseline — higher ambient temperature, flat orientation, enclosed panels — document the specific factors applied and the resulting adjusted ampacity. This creates a verifiable engineering record for inspections, maintenance, and future design changes.
Frequently Asked Questions
What is a busbar rating?
A busbar rating (also called ampacity rating) is the maximum continuous current a busbar can safely carry under defined conditions without exceeding a specified temperature rise. It depends on the busbar's material, cross-sectional area, installation environment, and operating frequency.
How to determine bus bar rating?
Consult an ampacity table for your conductor material and locate the row matching the busbar's dimensions. Read the ampacity value in the column that corresponds to the allowable temperature rise for your application.
What is ampacity in a busbar?
Ampacity is the maximum current a busbar can carry, expressed in amperes. Exceeding this threshold causes heat buildup that can push conductor temperature past the rated rise limit, risking damage to insulation or nearby components.
How does temperature rise affect the ampacity listed in a busbar table?
Tables list ampacity values at multiple temperature rise thresholds — commonly 30°C, 50°C, and 65°C. A higher allowable rise permits more current through the same cross-section. A lower threshold means you must either accept reduced current capacity or select a physically larger busbar.
Does busbar orientation affect its current rating?
Yes, orientation significantly affects ampacity. Busbars mounted on edge (narrow face down) dissipate heat more effectively due to greater exposed surface area than those mounted flat. Most published ampacity tables assume horizontal-on-edge mounting; flat mounting requires derating the listed value.