
Introduction
Undersized busbars are a hidden fault line in industrial power systems. When current density exceeds safe limits, resistance heating degrades insulation, accelerates oxidation at connection points, and triggers nuisance trips—or worse, equipment failure. In oil and gas operations, water treatment facilities, and manufacturing plants, a single overheated busbar can cascade into unplanned downtime costing thousands of dollars per hour.
Correct sizing is the difference between reliable uptime and preventable failure. This guide gives electrical engineers, system integrators, and plant engineers the calculation methods, code requirements, and field-tested best practices to size busbars correctly across switchgear, MCCs, and power distribution systems.
You'll learn how to calculate current density for copper and aluminum conductors, what IEC 61439 and the NEC actually require, and how enclosure design, harmonics, and bar stacking affect your final sizing decisions.
Key Takeaways
- Busbar current density is the current-to-area ratio (J = I/A), typically 1.2 A/mm² for copper and 0.8 A/mm² for aluminum
- The NEC's 1,000 A/in² rule applies only to bare copper bars in auxiliary gutters, not enclosed switchgear
- IEC 61439 governs through temperature-rise verification (65°C rise above 40°C ambient), not fixed density limits
- Stacked parallel bars require derating — a second bar adds roughly 64% more capacity, not double
- Validate enclosed or high-load designs with thermal simulation or testing, not formulas alone
What Is Busbar Current Density and Why It Matters
Busbar current density is the amount of electrical current flowing through a unit of cross-sectional area of the conductor. The formula is J = I / A, where J is current density, I is current in amperes, and A is cross-sectional area in mm² or in². This is distinct from ampacity, which refers to the total current-carrying capacity of the conductor under specific conditions.
Exceeding allowable current density has immediate thermal consequences. Resistance heating (I²R losses) drives temperature rise that degrades insulation, accelerates oxidation at connection points, and can trigger protective device trips.
Industry standards commonly cap temperature rise at 65°C above a 40°C ambient for enclosed busbars in switchgear — a threshold set specifically to prevent these failure modes.
Current density matters most in:
- Large switchgear assemblies
- Motor control centers (MCCs) serving VFDs and soft starters
- Power distribution panels and bus duct systems
- Manufacturing plants, water treatment facilities, and oil and gas operations
Busbar vs. Wire: Why Current Density Rules Are Different
Each of those applications presents unique enclosure and stacking challenges — which is where busbar diverges sharply from cable. Cable ampacity depends heavily on insulation type, conduit fill, and bundling. Busbar current density is governed by conductor geometry, surface area for heat dissipation, and installation environment.
Cross-sectional area becomes the primary design variable. That makes busbar sizing more predictable than cable, but also more sensitive to enclosure conditions and how conductors are stacked.
How to Calculate Busbar Current Density
Start with the base formula: Cross-Sectional Area (mm²) = Load Current (A) ÷ Allowable Current Density (A/mm²). Each variable represents a specific design input:
- Load Current (I): Maximum continuous current the busbar must carry, including any future load growth
- Allowable Current Density (J): Material-specific value based on conductor type and installation conditions
- Cross-Sectional Area (A): The resulting minimum conductor size, from which you select the next standard bar size
Worked Copper Example
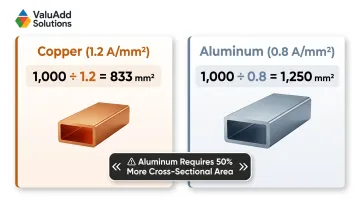
Calculate the minimum cross-sectional area for a 1,000 A copper busbar using a standard current density of 1.2 A/mm²:
A = 1,000 A ÷ 1.2 A/mm² = 833 mm²
From a standard busbar sizing table, select the next available size up—such as a 40 mm × 25 mm bar (1,000 mm²) or a 160 mm × 10 mm profile, depending on form factor and mounting constraints.
Worked Aluminum Example
For the same 1,000 A load using aluminum's lower current density of 0.8 A/mm²:
A = 1,000 A ÷ 0.8 A/mm² = 1,250 mm²
Aluminum requires approximately 50% more cross-sectional area than copper to carry the same current, though it is lighter and less expensive per unit volume.
Voltage Drop as a Secondary Check
After sizing for current density, verify that the selected busbar length and resistivity keep voltage drop within acceptable limits—typically 2–3% for feeder circuits, or as specified in project requirements. A busbar that passes the thermal check can still fail on electrical performance if the run is long or resistivity is underestimated.
The Role of Simulation Tools
The simplified current density formula assumes open-air or well-ventilated conditions. For enclosed designs with limited airflow or elevated ambient temperatures, dedicated software provides a more accurate thermal picture. Common options include:
- ETAP — full system power modeling with thermal analysis
- AutoCAD Electrical — layout-integrated sizing and verification
- FEM thermal modeling — finite element simulation of temperature rise under real enclosure conditions
Sizing Adjustment for Multiple Parallel Bars
Stacking multiple bars of the same size does not simply multiply capacity. Inner bars suffer from reduced heat dissipation, so engineers must derate current density per bar. For example, adding a second 1/4″ × 4″ copper bar increases ampacity at 65°C rise from 1,950 A to only 3,200 A—a 64% increase, not 100%. Standard ampacity tables from the Copper Development Association (CDA) and ATIS provide pre-calculated values for 2-, 3-, and 4-bar configurations that engineers should use rather than multiplying single-bar values.
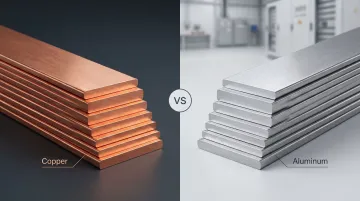
Copper vs. Aluminum: Current Density Values and Selection
Baseline current density values differ sharply by material. Copper supports approximately 1.2 A/mm², while aluminum runs at approximately 0.8 A/mm² under standard conditions. This difference stems from copper's higher electrical conductivity—100% IACS for ETP copper C11000—versus aluminum's lower conductivity (around 61% IACS for alloy 1350), which requires more cross-sectional area to carry the same current.
| Material | Conductivity (% IACS) | Typical Current Density | Key Characteristics |
|---|---|---|---|
| Copper C11000 | 100% | 1.2 A/mm² | Compact, high strength, preferred for MCCs |
| Aluminum 1350 | 61% | 0.8 A/mm² | Lightweight, lower cost, suitable for long runs |
| Aluminum 6101-T6 | 55% | ~0.75 A/mm² | Heat-treatable, higher strength for bus extrusions |
Practical Trade-Offs
Copper offers higher current density in a smaller footprint, which is critical where space is constrained, such as in dense motor control centers or compact switchgear assemblies. Aluminum is roughly one-third the weight of copper and less expensive per unit volume, making it preferable for long bus runs, outdoor installations, or applications where weight and cost matter more than compactness.
Skin Effect in AC Applications
At 60 Hz power frequencies, the skin effect causes alternating current to concentrate near the conductor surface, reducing the effective cross-section and increasing AC resistance. Wider, thinner bar profiles are preferred over thick square profiles because they present more surface area relative to cross-section. Skin effect ratio data from tables published by Storm Power Components or CDA shows how this impacts effective ampacity at different bus dimensions.
When to Choose Each Material
The right choice depends on the installation's space constraints, load profile, and run length:
- Copper: Use in switchgear, MCCs, and tight enclosures where compact sizing and reliability are the priority — including motor control centers serving VFDs or soft starters
- Aluminum: Use for long distribution runs, outdoor bus duct, and installations where weight savings and lower material cost outweigh the need for a smaller cross-section
Standards and Code Requirements for Busbar Current Density
NEC Requirements
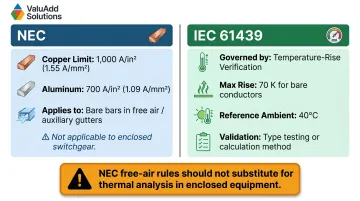
The National Electrical Code references 1,000 A/in² (approximately 1.55 A/mm²) for copper busbars in bare copper bars in sheet metal auxiliary gutters. This is a simplified sizing rule for single conductors in free air — not a substitute for full thermal analysis in enclosed equipment. NEC limits by material:
- Copper busbars: 1,000 A/in² (1.55 A/mm²)
- Aluminum busbars: 700 A/in² (1.09 A/mm²)
IEC 61439 Requirements
This international standard for low-voltage switchgear and controlgear assemblies governs busbar sizing through verified temperature-rise limits rather than prescribing a fixed current density value. IEC 61439-1:2020 permits a maximum temperature rise of 70 K for bare copper or aluminum busbars, measured against a 35°C reference ambient (equivalent to a 65°C rise above 40°C ambient in practice). Manufacturers must verify through type testing, calculation, or comparison with a tested reference design.
IEEE Considerations
IEEE 519-2014 governs harmonic compliance and has indirect relevance to busbar sizing. Harmonic currents from VFDs and nonlinear loads increase RMS current in busbars, which increases thermal demand and may require a larger cross-section than the fundamental current alone would suggest.
In facilities where harmonic distortion is a known concern, specifying IEEE 519-compliant drives directly reduces the harmonic load on busbars. ValuAdd's Benshaw H2 519/519P Series Clean Power Drives, for instance, reduce harmonic distortion to less than 8% THDv and 5% TDDi, which can meaningfully lower thermal demand on downstream busbars in VFD-heavy applications.
Factors That Influence Effective Current Density in Practice
Ambient Temperature and Enclosure Conditions
Standard current density values assume a 40°C ambient. Enclosed busbars with limited ventilation experience higher operating temperatures, requiring derating. Proximity to other heat-generating devices (transformers, drives) must also be factored in.
For copper busbars, typical correction factors are:
- 0.91 at 40°C ambient
- 0.82 at 50°C ambient
A sealed enclosure with no ventilation significantly reduces ampacity compared to free-air installations.
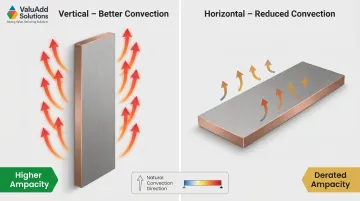
Busbar Orientation
Mounting a busbar with its long axis vertical (edge-on) improves natural convection cooling compared to flat (horizontal) mounting, allowing higher current density. Published ampacity tables—such as ATIS T1.311 for DC busbars—provide separate ratings for vertical versus horizontal configurations. If the long axis is placed horizontally or spacing between parallel bars is less than the thickness of the bars, the ampacity rating must be derated.
Surface Finish and Emissivity
Surface coatings affect how efficiently a busbar radiates heat. Standard CDA ampacity tables assume an emissivity of 0.4, typical of copper exposed to an industrial environment for 60 days. Bare, bright copper has very low emissivity (0.10), while heavily oxidized copper reaches 0.70.
Increasing emissivity from 0.15 to 0.90 through surface treatments or paint can increase ampacity by over 25% for a given temperature rise. Highly reflective finishes like silver or tin plating have very low emissivity, which can restrict radiative cooling despite their excellent contact resistance properties.
Best Practices for Busbar Current Density in Industrial Systems
Design to the Conservative Standard
For enclosed switchgear or MCC applications, do not use the NEC free-air current density value. Instead, use IEC 61439 temperature-rise verification or the conservative ampacity values from certified rating tables that account for enclosure effects. IEC-certified rigid copper bars rated for primary and secondary distribution are available through ValuAdd, ensuring the components you specify meet international standards for safety and performance.
Account for Future Load Growth
Size busbars for 125% or more of the calculated current demand where load growth is anticipated. This margin also buffers against harmonic loading from variable frequency drives and other nonlinear loads common in manufacturing. Harmonic currents can produce additional heating that standard ampacity calculations don't fully capture.
ValuAdd supplies Isoflexx® laminated busbars — UL Listed and CE Certified — for switchgear applications where flexibility and certified ratings are both required.
Conduct or Require Thermal Validation Testing
Once sizing and layout are finalized, thermal validation is the critical last step — especially for custom designs in high-consequence applications:
- Thermal imaging under load identifies hot spots that calculations may not predict
- Continuous current testing confirms actual temperature rise matches design targets
- Field verification is particularly important in oil and gas, water treatment, and critical manufacturing environments where unplanned downtime carries serious consequences

ValuAdd's technical team can support system integrators and plant engineers through component selection and commissioning — ensuring designs that work on paper also perform reliably in the field.
Frequently Asked Questions
What is the current density of a busbar?
Busbar current density is the load current divided by the conductor's cross-sectional area (J = I/A). Common baseline values are approximately 1.2 A/mm² for copper and 0.8 A/mm² for aluminum under standard conditions (40°C ambient, single bar, adequate ventilation).
What is the standard current density?
The NEC references 1,000 A/in² for copper in free air (auxiliary gutters), while IEC 61439 governs enclosed equipment through temperature-rise limits (65°C rise above 40°C ambient) rather than a fixed density value. The widely used engineering rule of thumb is 1.2 A/mm² for copper busbars in typical industrial installations.
How do you calculate busbar current density?
Use J = I/A: divide load current (amperes) by the conductor's cross-sectional area (mm²) to get current density. To size a busbar, divide the required current by the allowable density for the material, select the next standard bar size up from an ampacity table, then verify voltage drop and temperature rise.
What is the difference in current density between copper and aluminum busbars?
Copper supports approximately 1.2 A/mm² versus aluminum's 0.8 A/mm², meaning aluminum requires roughly 50% more cross-sectional area to carry the same current. However, aluminum is lighter and less costly, making it suitable for long runs and outdoor installations.
How does temperature affect busbar current density?
Higher ambient temperatures or enclosed installations reduce allowable current density because the busbar has less thermal headroom before reaching its operating limit, typically 65°C rise above a 40°C ambient per IEC 61439. When ambient exceeds 40°C, published derating factors must be applied.
Does busbar orientation affect current-carrying capacity?
Yes—a busbar mounted with its long axis vertical (edge-on) dissipates heat more effectively through natural convection than one mounted flat, resulting in slightly higher allowable current for the same cross-section. Published ampacity tables typically provide separate ratings for each orientation.