Introduction
Most industrial facilities have no granular visibility into where energy is being wasted until equipment fails or utility bills spike. Three scenarios play out more often than they should:
- A pump motor drawing excessive current for weeks goes unnoticed until it fails
- A poorly tuned variable frequency drive injects harmonics that degrade power quality across the distribution network
- Equipment starts overlap during a 15-minute window, triggering a demand charge that inflates the utility bill by thousands of dollars for the month
Without continuous electrical visibility, operations teams stay in reactive mode — addressing problems only after they've already hit production or budget.
Industrial power metering systems and energy monitors close that visibility gap. This guide covers what these systems measure, which features matter in demanding environments, how they integrate with SCADA and building automation platforms, and how they translate into measurable savings: demand charge reduction, predictive maintenance, and power quality compliance.
TLDR:
- Industrial power meters capture real-time electrical parameters (voltage, current, power factor, harmonics) across distribution networks
- Demand charges account for 30-70% of monthly utility bills, driven by single 15-minute peak intervals
- IEEE 519-compliant harmonic monitoring prevents equipment failures and regulatory penalties
- Communication protocols like Modbus and DNP3 enable SCADA integration and automated demand response
- Accurate submetering identifies energy waste and supports predictive maintenance before failures occur
What Are Industrial Power Metering Systems and Energy Monitors?
Industrial power metering systems continuously measure, record, and report electrical parameters—voltage, current, power, and energy—across a facility's distribution network. Unlike utility billing meters at the service entrance, they provide granular visibility into individual loads, circuits, and equipment throughout a facility.
These systems are formally classified as Power Metering and Monitoring Devices (PMDs) under IEC 61557-12, which specifies requirements for devices used in electrical distribution systems for safety, verification, and performance optimization.
Power Meters vs. Energy Monitors: Understanding the Distinction
- Power meters capture instantaneous electrical parameters in real time: voltage, current, power factor, and kilowatts at any given moment.
- Energy monitors aggregate consumption data over time, tracking kilowatt-hours (kWh), trends, costs, and anomalies across hours, days, or billing periods.
Modern industrial units typically combine both functions in a single device, providing real-time diagnostics and historical analytics.
Why Industrial-Grade Systems Differ from Commercial Meters
Industrial environments demand more than commercial or residential metering capabilities. Industrial-grade systems must:
- Handle three-phase power with high voltages (up to 690 VAC or higher) and currents ranging from tens to thousands of amperes
- Survive harsh physical environments—dust, moisture, vibration, temperature extremes, and corrosive atmospheres
- Integrate with SCADA, DCS, or PLC systems using industrial communication protocols like Modbus RTU/TCP, DNP3, Profibus, or Ethernet/IP
- Provide high accuracy (Class 0.2 or better) for revenue-grade applications or submetering
- Monitor power quality parameters like harmonics, voltage sags, and phase imbalances that directly impact equipment reliability
ValuAdd's power monitoring portfolio includes multi-circuit monitoring devices built to these specifications, carrying UL, CE, and IEEE 519 compliance alongside IP65/66/68 and NEMA Type 4X and 12 ratings for facilities where reliability and accuracy are non-negotiable.
Key Measurements Industrial Power Meters Capture
Industrial power meters go far beyond tracking total kilowatt-hours. They monitor a comprehensive set of electrical parameters that directly impact equipment performance, utility costs, and system reliability.
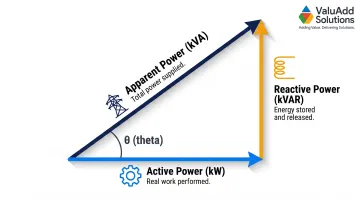
Active, Reactive, and Apparent Power: The Foundational Trio
Three interconnected measurements define how power flows through an industrial system:
- Active power (kW): Real power converted into useful work—running motors, heating elements, or lighting
- Reactive power (kVAR): Non-working power required by inductive and capacitive loads (motors, transformers, compressors, VFDs) to establish magnetic fields
- Apparent power (kVA): The vector sum of active and reactive power, representing total power the utility must supply
Tracking reactive power is critical in industrial settings. Utilities penalize customers for poor power factor (typically below 0.85 or 0.95) because supplying excess reactive power requires larger generation and transmission capacity. For example, Georgia Power charges $0.42 per excess kVAR for power factors below 95% lagging. Monitoring kVAR in real-time enables facilities to identify when and where capacitor banks or VFD tuning are needed to reduce penalties.
Voltage and Current Measurement Across All Three Phases
Industrial meters measure voltage and current independently on each of the three phases (L1, L2, L3), enabling detection of phase imbalances. Even minor imbalances have severe consequences: NEMA MG 1-2016 states that voltage unbalance exceeding 1% requires motor derating to prevent overheating and premature failure. A 1% voltage unbalance can cause motor winding temperatures to rise significantly, voiding warranties and accelerating bearing wear.
Harmonic Analysis and Total Harmonic Distortion (THD)
Non-linear loads—variable frequency drives, rectifiers, uninterruptible power supplies, and switchgear—generate harmonic distortion that degrades power quality. Harmonics cause transformer overheating, nuisance tripping of circuit breakers, and resonance conditions that damage sensitive equipment.
IEEE 519-2022 establishes voltage and current distortion limits at the user's Point of Common Coupling (PCC). For systems rated 120V through 69kV, Total Demand Distortion (TDD) limits vary based on the ratio of short-circuit current to maximum demand load. IEEE 519-compliant metering is the baseline requirement for detecting and managing THD before it triggers equipment failures or regulatory penalties.
Demand Measurement and Peak Demand Tracking
Demand charges can account for 30% to 70% of an industrial facility's monthly utility bill, often determined by the highest 15- or 30-minute average demand window during the billing period. A single 15-minute spike—caused by overlapping equipment startups—can set the demand charge for the entire month.
Power meters that capture demand data in real-time enable engineers to identify and shed non-critical loads before demand peaks are triggered. Continuous demand monitoring supports automated load management strategies that can save tens of thousands of dollars annually.
Power Quality Event Logging
Voltage sags, swells, transients, and interruptions—collectively known as power quality events—can cause unplanned downtime, data loss, and equipment damage. The cost of unplanned downtime in manufacturing averages $260,000 per hour. Meters that log power quality events with timestamps enable facilities to correlate equipment failures with electrical disturbances, supporting root cause analysis and preventive action.
Critical Features to Look for in Industrial Power Meters
Selecting the right industrial power meter requires matching device capabilities to application requirements. Here are the key features that define performance, reliability, and integration in demanding industrial environments.
Accuracy Class: Matching Precision to Application
Accuracy class defines the maximum permissible error of a power meter under specified conditions. Common accuracy classes include Class 0.2, 0.5, and 1.0—where the number represents the maximum percentage error at full load.
When to specify each class:
- Class 0.2: Revenue-grade billing, financial settlement, and applications requiring the highest precision
- Class 0.5: Internal submetering, energy management, and facility monitoring
- Class 1.0: General-purpose monitoring and retrofit applications
ValuAdd's DIRIS B power monitoring device provides Class 0.2 accuracy per ANSI C12.20 standards, exceeding revenue-grade requirements and ensuring reliable data for both billing and energy analysis applications.
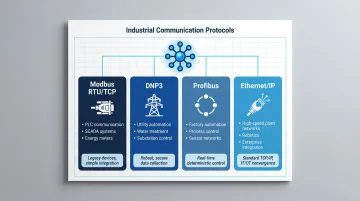
Communication Protocols and Integration
Industrial power meters must connect directly to existing SCADA, DCS, building automation, or energy management systems. Open communication protocols prevent vendor lock-in and ensure interoperability across multi-vendor installations.
Key protocols and their applications:
- Modbus RTU/TCP: The most widely supported protocol for local device communication, universally compatible and simple to implement
- DNP3: Dominant in utility SCADA and wide-area telemetry, supporting event-driven unsolicited reporting and timestamped data
- Profibus: Common in process automation and European manufacturing facilities
- Ethernet/IP: Preferred in discrete manufacturing and Allen-Bradley ecosystems
ValuAdd's DIRIS Digiware series supports Modbus RTU, Modbus TCP, BACnet IP, and SNMP, ensuring compatibility with diverse industrial networks and providing flexible options for remote monitoring.
Environmental Ratings and Enclosure Standards
Industrial meters deployed in harsh environments require appropriate Ingress Protection (IP) ratings per IEC 60529 or NEMA enclosure types per NEMA 250.
Critical ratings for industrial environments:
- IP65/66: Protection against dust and water jets, suitable for dusty or washdown environments
- IP68: Complete dust protection and submersion resistance for the most extreme conditions
- NEMA Type 4X: Indoor or outdoor use with corrosion resistance, ideal for chemical or food processing
- NEMA Type 12: Indoor use, protection against dust and dripping liquids, standard for general manufacturing
ValuAdd's power monitoring solutions carry IP65, IP66, and IP68 ratings alongside NEMA Type 4X and 12 compliance. That coverage spans the full range of demanding plant environments — from wet process areas to corrosive atmospheres.
Display and User Interface
Display requirements vary by application. Two common configurations cover most installations:
- Panel-mount meters: High-brightness displays provide in-panel real-time readouts for operators and maintenance staff, eliminating the need for remote access during troubleshooting
- Headless meters: Rely entirely on software dashboards, ideal for centralized monitoring where physical access is infrequent
ValuAdd covers both configurations — the DIRIS A-20 features a large backlit LCD for panel mounting, while the DIRIS Digiware C-31 operates as a headless interface for centralized SCADA integration.
Data Logging and Cloud/Edge Connectivity
Data retention and connectivity requirements differ depending on deployment scale:
- Local storage: Onboard memory retains historical data for trend analysis and compliance logging without external export
- Cloud-connected meters: Enable remote monitoring across multiple plant locations, supporting enterprise-wide energy management and predictive analytics
- Edge computing: Local processing reduces latency for time-sensitive alarm and control functions
The DIRIS Digiware series addresses all three through embedded web server capabilities and multi-protocol connectivity, supporting remote visualization and integration with cloud-based energy management platforms.
How Industrial Power Metering Reduces Costs and Downtime
Industrial power metering systems deliver measurable financial and operational benefits by providing visibility into energy consumption, demand patterns, and equipment health.
Identify and Eliminate Energy Waste
Submetering individual loads—motors, HVAC systems, compressors, and process lines—reveals which equipment consumes disproportionate energy and when. This visibility enables targeted efficiency programs with measurable ROI rather than broad guesses.
Example applications:
- Identifying motors running at partial load with poor efficiency
- Detecting compressed air leaks by monitoring compressor runtime and energy consumption
- Tracking HVAC energy use by zone to optimize schedules and setpoints
ValuAdd's DIRIS B supports four independent current inputs, enabling simultaneous monitoring of multiple circuits and simplifying energy attribution across production lines.
Demand Charge Reduction
Continuous demand monitoring allows operations teams to stagger equipment startups or automate load shedding during peak windows. Given that demand charges represent 30-70% of an industrial facility's total utility bill, even small reductions translate directly to lower monthly bills.
For example, Agropur Dairy Cooperative uses demand response strategies such as cooler temperature setbacks and turning off wastewater treatment plants during demand response events, yielding an average of $12,000 annually in incentives.
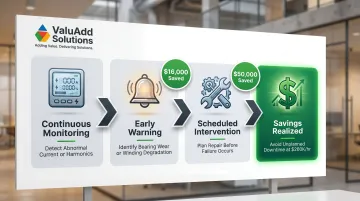
Predictive Maintenance Through Power Quality Data
Abnormal current draw, voltage imbalances, or rising harmonic levels are often early indicators of motor bearing wear, winding degradation, or failing capacitors. Metering data allows maintenance teams to act before a failure causes unplanned downtime.
Motor Current Signature Analysis (MCSA) and vibration monitoring can identify impending stator faults, rotor bar damage, and bearing degradation. San Jose Water detected a 25% current unbalance early enough to intervene before full motor failure—saving $16,000 and cutting repair time from 6-12 months down to three weeks.
An Ameren pilot program estimated annual savings of $50,000 per unit on condensate systems by adding MCSA and vibration sensors, demonstrating the financial impact of predictive maintenance strategies enabled by continuous electrical monitoring.
Power Factor Correction
Meters that track power factor enable facilities to identify when and where capacitor banks or VFD tuning are needed to reduce reactive power penalties from utilities. By monitoring displacement power factor and total power factor, engineers can target specific loads for correction, avoiding blanket installations that may create resonance or overcompensation.
Selecting the Right Power Metering System for Your Industry
Application context drives meter selection. Different industries face distinct challenges that require tailored metering capabilities.
Industry-Specific Requirements
Water treatment facilities monitor pump motors in harsh, wet environments. Requirements include IP65/66 ratings, SCADA integration via Modbus or DNP3, harmonic compliance to manage VFD distortion, and multi-point submetering across distributed pump stations.
Oil and gas operations require hazardous area ratings (ATEX, IECEx, NEC Class I Division 1/2), multi-point submetering across remote wellheads and compressor stations, and robust communication over long distances using DNP3 or serial protocols.
Discrete manufacturing plants need machine-level energy attribution to correlate consumption with production output, high-speed sampling for power quality diagnostics, and integration with MES or ERP systems to allocate energy costs to specific jobs or products.
ValuAdd configures solutions for each of these sectors — matching environmental ratings, communication protocols, and accuracy classes to the specific installation.
Panel-Mount, DIN-Rail, and Portable Analyzers
Once you've defined your industry requirements, form factor determines where the meter fits physically and how operators interact with it.
Panel-mount meters go directly into distribution panels or machine control cabinets, giving operators on-site visibility without pulling up a software dashboard. The DIRIS A-20, for example, includes a large backlit LCD display suited for high-traffic control rooms.
DIN-rail submeters fit inside existing electrical enclosures with minimal footprint. The DIRIS B supports four independent current inputs on a single compact unit — practical for multi-circuit monitoring where panel space is tight.
Portable power quality analyzers handle commissioning checks and fault diagnosis without permanent installation. Most facilities run a mix of fixed submeters and portable units — the permanent meters handle baseline tracking while portables go where the problem is.
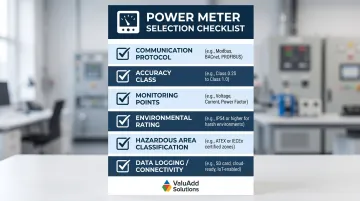
Integration Requirements Checklist
Before purchasing, assess the following:
- What communication protocol does your SCADA or EMS use?
- Do you need revenue-grade (Class 0.2) or check-metering (Class 0.5/1.0) accuracy?
- How many points need to be monitored, and what is the expected current range?
- Does the installation environment require IP or NEMA-rated enclosures?
- Are there hazardous area classifications that require ATEX, IECEx, or NEC compliance?
- What data logging capacity and cloud connectivity are required for your application?
ValuAdd's engineers help customers evaluate these requirements and select the right meter configuration before purchase.
Frequently Asked Questions
What is a power monitoring system?
A power monitoring system is a network of meters and software that continuously measures electrical parameters across a facility's distribution system, providing real-time and historical data to support energy management, cost control, and equipment protection.
What is the difference between BMS and EPMS?
A Building Management System (BMS) controls HVAC, lighting, and other building systems. An Electrical Power Monitoring System (EPMS) focuses specifically on measuring and analyzing electrical power quality, consumption, and distribution. The two are complementary and frequently integrated in the same facility.
What runs up your electric bill the most?
In industrial facilities, the largest contributors are typically high-horsepower motors running at partial loads, poor power factor resulting in reactive power penalties, and demand charges triggered by equipment starting simultaneously during peak windows.
What is the difference between a power meter and an energy monitor?
Power meters measure instantaneous electrical parameters — voltage, current, power factor — in real-time, while energy monitors aggregate consumption data over time. Industrial-grade devices now routinely combine both functions in a single unit.
What communication protocols do industrial power meters use?
Common protocols include Modbus RTU/TCP, DNP3, Profibus, and Ethernet/IP — protocol support determines how easily a meter integrates with existing SCADA or DCS platforms. ValuAdd's DIRIS Digiware series covers Modbus RTU, Modbus TCP, BACnet IP, and SNMP for broad compatibility.
How do I know if my facility needs a power metering system?
Key signals include unexplained increases in utility bills, frequent equipment failures without a clear cause, inability to attribute energy costs to specific production lines, and compliance requirements under IEEE 519 or utility demand response programs.